February 2024 Toronto Real Estate Market Statistics. Toronto housing prices in February 2024. Highest customer rated real estate agents in Toronto
Thursday Mar 07th, 2024
REFLECTING ON LAST YEAR 2023:
💡 Reflecting on last year, the number of homes sold in the Greater Toronto Area (GTA) in 2023 came in at less than 70,000. To put things into perspective, the strong seller's market in 2021 saw a record of 121,712 sales: this means in 2023, we saw only 58% of the volume of sales that we saw in 2021. The significant reduction in sales volumes was driven by Canada's unsustainably high mortgage interest rates which is at a 22-year high, and this significantly impacts affordability for both purchasers and property owners.
INCREASED BUYER ACTIVITY AT THE START OF 2024:
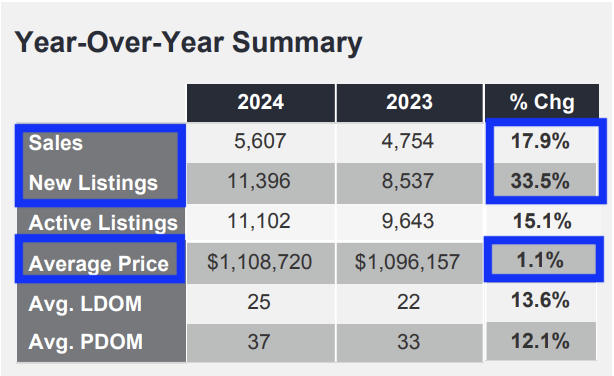
🏡 Not surprisingly, home sales during last month February were up +17.9% compared to the same time last year. This is because we are comparing it to February 2023 home sales which had been slower at only 4,783 sales. Our February 2024 sales volume of 5,607 is moving towards volumes that we see in a more balanced market.
📊 Why did we see increased buyer activity at the start of 2024? Despite the Bank of Canada holding the key rate steady this week and also back on January 24th, banks began decreasing fixed-rate mortgages. Some buyers took advantage of the decreased rates while our current housing prices remain a bit soft, rather than taking a chance to wait for interest rates to further decrease which is when housing prices are expected to increase. Also, many buyers who have waited on the sidelines over the past two years watching mortgage rates increase, have come to terms with the higher rates and have saved a larger down payment to help them enter our current ideal market for buyers.
PRICE & SALES VOLUME:
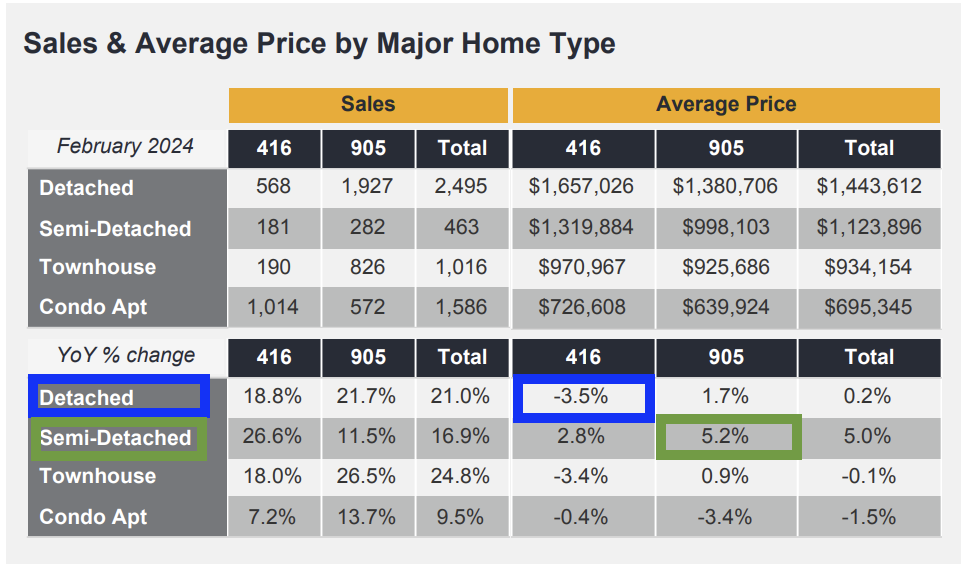
🏡 ANNUAL COMPARISON: Compared to February 2023, the average property price across the board held on with a slight increase of +1.1% with the average property price at $1,108,720. Note that different housing types varied in performance, especially in different neighbourhoods: semi-detached homes in the "905" suburbs saw the largest annual price increase on average at +5.2%. In comparison, the average Toronto detached home experienced the most challenge with a -3.5% price decrease over the past year.
📉 MONTHLY COMPARISON: If we look at the month-to-month comparison between February 2024 and January 2024, the GTA stats are trending upwards for both sales volumes and housing prices. Sales volumes increased by +32.7% and the average property price on a month-to-month comparison increased by +6.9%. Another positive trend for property owners and current sellers is that every single property type saw average price increases ranging from a +1.2% increase for condos to a +8.2% increase for semi-detached homes.
The annual and monthly price trends indicate that while some housing sectors remain a bit soft on price, we are seeing buyer activity slowly picking up and this explains why every housing sector increased in price, on average, throughout the GTA between January 2024 and February 2024.
📣 The number of new listings is up by a significant +33.5% annually in the GTA. In combination with other market factors such as sales volumes up by about half as much at +17.9%, we are still leaning towards a favourable market for buyers in most areas of the GTA.
THIS IS THE IDEAL MARKET FOR: while there are many opportunities throughout the GTA, our current market is ideal for purchasing real estate. Housing prices, for the most part, remain a bit soft and if you have been waiting for interest rate hikes to stop while still taking advantage of softer real estate prices, this is the market to make that move.


